Rust SDK 1.0: error monitoring for Axum, Actix Web and Tokio
Capture Rust errors, failed requests and structured logs with DebugBundle 1.0. Add context from Axum, Actix Web and Tokio to debugging with AI coding agents.

By Owen Far
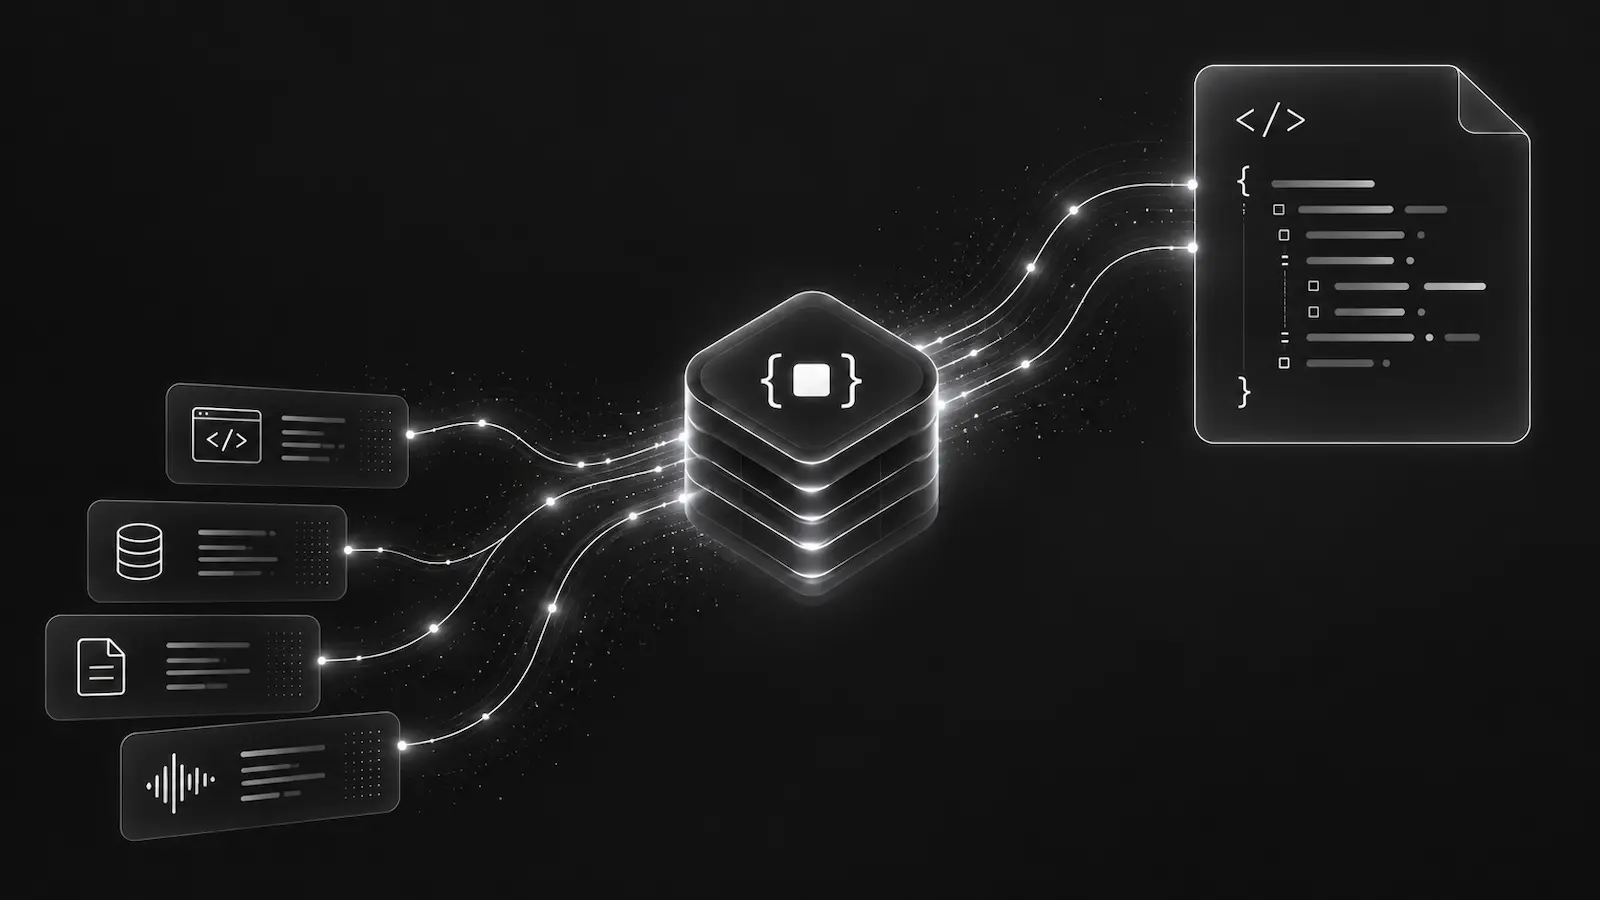
A Rust API returns a 500. A background task reports an error. The logs show a failed operation, but the request that triggered it and the useful context are scattered across async tasks. The compiler has done its job; there is still a production incident to understand.
DebugBundle for Rust 1.0 is available on crates.io. It brings Rust error monitoring and structured incident evidence to standalone services, Tokio applications, Axum and Actix Web. Errors, failed requests, selected logs and diagnostic context feed the same debug bundles used by the other DebugBundle SDKs.
That gives an engineer or AI coding agent a concrete starting point: what failed, which service and environment were involved, and what evidence was captured around the failure.
Install and initialize
The SDK requires Rust 1.89 or newer. Add the crate to your application:
cargo add debugbundleSet DEBUGBUNDLE_PROJECT_TOKEN in the server environment, then initialise the client during application startup:
use debugbundle::Config;

let client = debugbundle::init(Config {
    project_token: std::env::var("DEBUGBUNDLE_PROJECT_TOKEN").unwrap_or_default(),
    environment: "production".into(),
    service: "api".into(),
    ..Config::default()
});
Keep client alive for the application lifetime. The project token selects the destination, while environment and service identify where the event came from. This example uses connected HTTP delivery.
Initialization creates the client. Add the framework middleware, logging integration or explicit capture calls for the evidence your application needs. Panic observation is also an explicit opt-in.
Axum and Actix Web error monitoring
Rust web services already have a place to observe request outcomes: the middleware around their handlers. DebugBundle provides integrations for Axum 0.8, Tower 0.5 and Actix Web 4.
For an Axum application using tracing, enable those optional features in Cargo.toml:
[dependencies]
debugbundle = { version = "1.0.1", features = ["axum", "tracing"] }
Apply debugbundle::axum::DebugBundleLayer::new(client.clone()) to your router. For Actix Web, select the actix-web feature instead of axum and wrap the app with debugbundle::actix_web::DebugBundleMiddleware::new(client.clone()).
The middleware records selected failed request outcomes and provides request context while preserving the application's response and error behaviour. Request bodies are not read automatically. The Rust SDK guide explains context access, optional body snapshots and complete integration setup.
A 500 response tells you that a request failed. An explicit error snapshot or a structured log from the failing operation can explain more. Combining those observations is what makes an incident useful to investigate.
Keep Tokio tracing and structured logs useful
Async tasks can interleave their log output. Structured fields and operation context help retain the relationship between an event and the work that produced it.
The optional tracing integration provides client.tracing_layer(), which composes with an application's existing subscriber. The log integration can tee an existing logging sink. If your application bridges log into tracing, choose one DebugBundle sink to avoid reporting the same log through both paths.
Use primitive structured fields for diagnostic context. For application errors, explicit snapshots can supply known names, messages and causes. Borrowed errors do not run arbitrary Display, Debug or Error::source implementations during capture, so the SDK does not promise to extract every detail from an anyhow or thiserror chain.
Panic reporting is available through client.install_panic_observer(); retain the returned guard while observation is needed. Abrupt process termination can still prevent delivery. The runtime and API guide covers these boundaries and async context propagation.
Connect browser failures to the Rust backend
Both Axum and Actix Web include a browser relay for applications with a frontend. The Browser SDK sends events to /debugbundle/browser, and the Rust backend validates them and uses the server-side project token for upstream delivery.
This keeps the server credential out of browser code and supports a shared investigation across frontend and backend services. Configure allowed origins and trace propagation deliberately; a browser failure and a backend error appearing close together do not establish that they are the same incident.
The browser relay guide covers frontend setup, service names and verification. Keep frontend and backend service names distinct within the same system project.
Verify the first event, locally or connected
After wiring the integration, trigger a deliberate setup event in a development or staging application. Confirm the matching service and environment in the received event or incident. Creating a client or draining its queue does not prove delivery.
For local Rust debugging, enable the local feature and select Config::local explicitly. Events stay in local files that the CLI can process into bundles. Connected mode uses HTTP even when the environment is development; changing the environment name alone does not select local storage.
Capture uses bounded queues and can drop telemetry under contention or overload. Bounded flushing belongs in verification or controlled shutdown, outside ordinary request handlers. Follow the first-event verification steps for your chosen destination.
Give your AI coding agent the incident context
Once an incident bundle is available, the CLI or MCP integration lets your coding agent inspect the recorded evidence alongside your repository.
For example:
Inspect the bundle for this Rust API failure. Compare the failed request with the captured error and logs, then locate the relevant handler or task in this repository. Explain what the evidence supports, identify anything missing, and propose a focused fix with a regression check.
The bundle narrows the investigation. The agent still needs to inspect the code and test its explanation against the failing path.
Start with the Rust SDK guide for installation, integrations, verification and configuration. The SDK repository includes examples for standalone Rust, Tokio, Tower, Axum, Actix Web and logging.
Debug production errors with your AI agent
DebugBundle captures errors and their surrounding context in structured debug bundles, giving your coding agent the evidence to investigate.
Open source · Start free