
Detect, investigate, and resolve failures faster
Turn production errors into agent-ready debug bundles
DebugBundle detects errors in production, groups related failures into incidents, and delivers agent-ready debugging context through API, CLI, MCP, and the dashboard so humans and AI agents can find and fix the underlying bugs.
Quick installation guide
Choose the agent path, or install the CLI and integration manually.
Agent Path
Set up DebugBundle for this repository end to end. Inspect the project language, framework, package manager, entry points, logging setup, and whether it has a frontend, browser surface, or server-rendered UI. Read the relevant DebugBundle docs: https://debugbundle.com/docs/installation, https://debugbundle.com/docs/quickstart, https://debugbundle.com/docs/project-setup/connect-to-cloud, https://debugbundle.com/docs/cli/cloud-workflow, https://debugbundle.com/docs/cli/local-workflow, https://debugbundle.com/docs/sdks, https://debugbundle.com/docs/integrations/wordpress, and https://debugbundle.com/docs/agent-workflows/skill-file. Run `debugbundle setup`, then read and follow `.agents/skills/debugbundle/SKILL.md`. Choose Cloud mode for hosted deployment or shared incident workflows; otherwise use local-only mode. If Cloud is appropriate, run `debugbundle login` and `debugbundle connect`. Install the smallest safe integration path: backend SDK, WordPress plugin, or log ingestion. If the repository or deployment target is WordPress, use the DebugBundle WordPress plugin instead of installing the PHP SDK or Browser SDK directly on the WordPress host; still keep the `debugbundle setup` scaffold in the repo, but let the plugin own backend capture, browser capture, relay setup, and token storage. For browser-capturable UI, also install the Browser SDK and configure same-origin relay for full-stack apps or direct capture for frontend-only apps. Configure required env vars or tokens. Trigger one intentional test error through the real ingestion path. Verify with `debugbundle verify cloud` or `debugbundle verify local`, then show the incident using `debugbundle incidents --source cloud|local` and inspect it with `debugbundle inspect <incident-id>`.Use this prompt to let your coding agent set up and choose the right DebugBundle mode.
CLI
npm install -g @debugbundle/cli
debugbundle --version

debugbundle setup
Install the CLI, confirm it is available, then scaffold the project. Follow Quickstart for the full setup flow.
SDKs
npm install @debugbundle/sdk-nodeimport DebugBundle from '@debugbundle/sdk-node';
DebugBundle.init({
projectToken: 'local',
environment: 'production',
service: 'api',
});Why use DebugBundle?
Logs tell you what happened.
DebugBundle tells you what to do next.
Know when errors happen
Turn unexpected exceptions, request failures, and critical logs into incidents and alerts instead of waiting for someone to notice a log line.
Capture the full context
Keep the surrounding request, response, logs, breadcrumbs, deploy metadata, and runtime details with the incident so debugging starts with evidence, not guesswork.
Find hidden improvements
Promote repeated warnings, slow paths, and recurring request patterns into improvement opportunities before they grow into failures.
Understand product usage
Use privacy-safe routes, semantic actions, funnels, conversions, and friction signals to see where product journeys work or break down.
Alert on critical paths
Create custom alerts for high-value routes, jobs, and services that may never surface in user-facing dashboards but still matter to the business.
Hosted health checks
Know when your site or API is down. DebugBundle checks your public endpoints and opens an incident when they stay unreachable.
Remote probes on demand
Enable remote probes temporarily to expose deeper runtime details on a running service without deploying new debugging code.
Incident to PR
Send bundles through webhooks, API, CLI, or MCP so an agent can inspect the incident, reason over the codebase, and open a proposed fix.
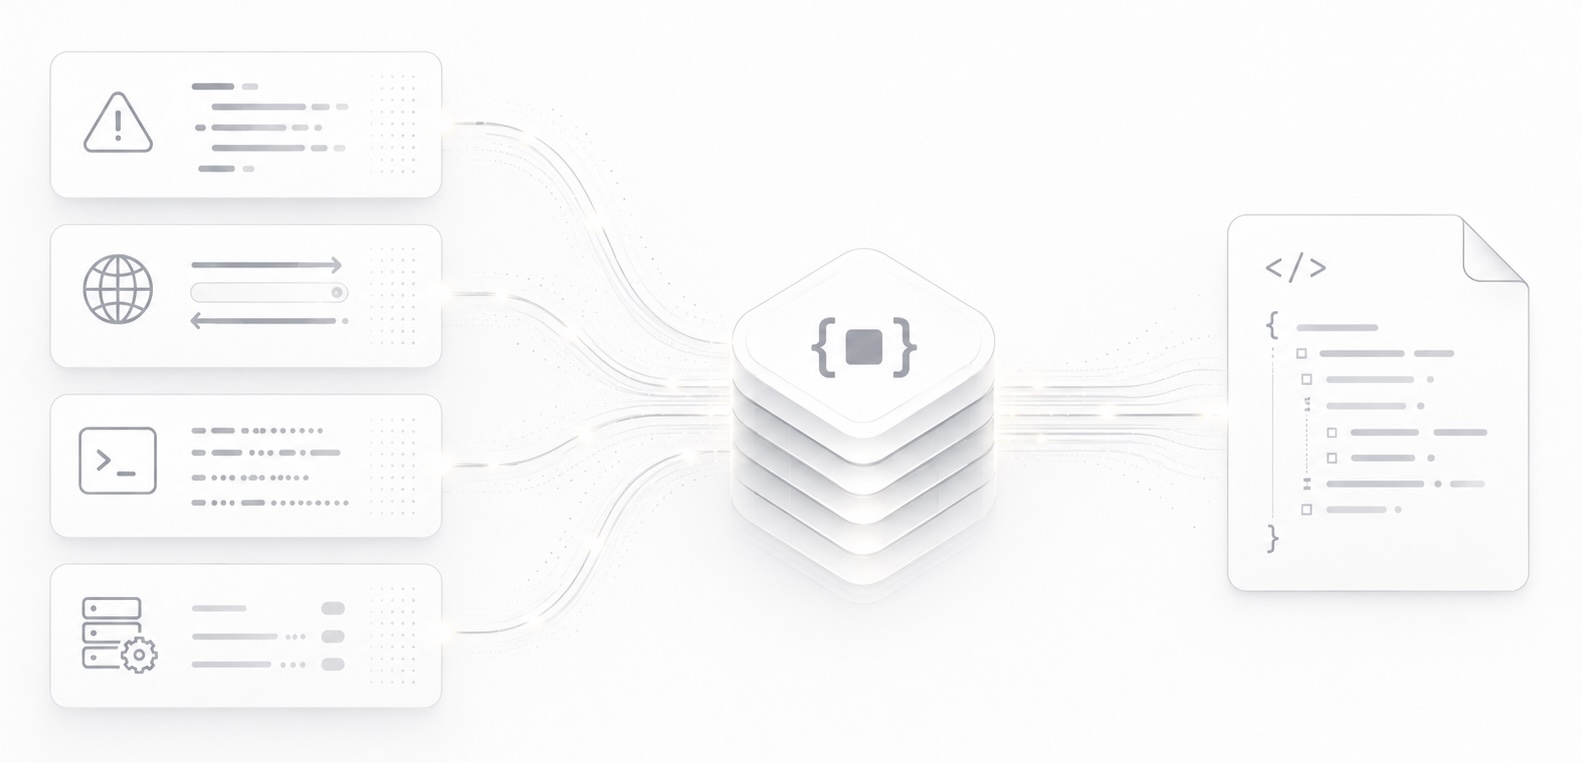
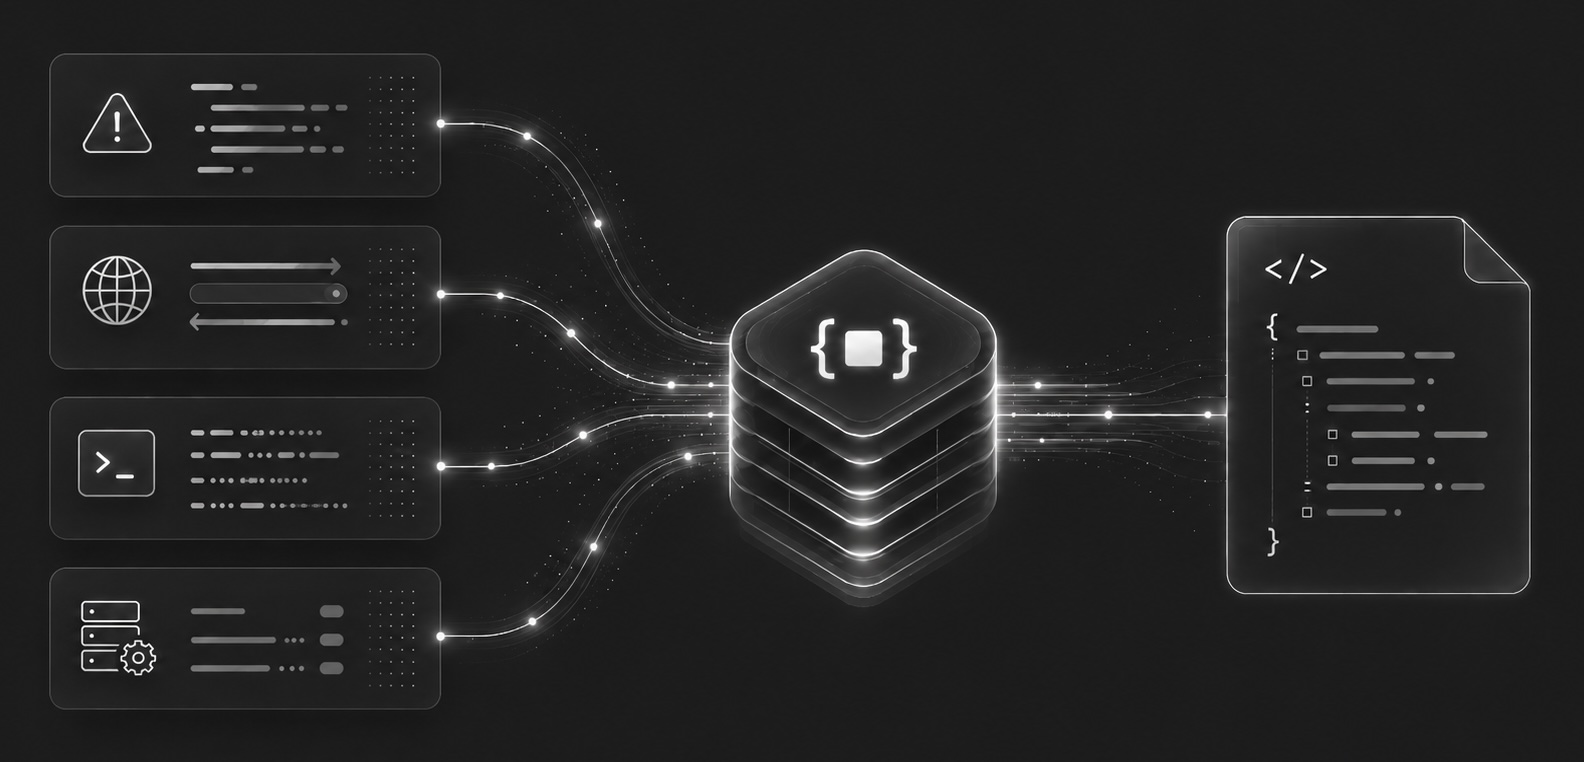
How it works
Capture the incident, normalize the signal, assemble the bundle, and inspect the same artifact everywhere.
Capture
SDKs capture exceptions, requests, logs, breadcrumbs, and probes from your app.
Normalize
Events are redacted, fingerprinted, and grouped into incidents automatically.
Bundle
DebugBundle assembles deterministic incident context with reproduction hints.
Resolve
Humans and agents inspect the same bundle through dashboards, API, CLI, or MCP.
Platform strengths
Built for production AI debugging
DebugBundle is shaped for real incident response: stable artifacts for agents, the same operational flow across interfaces, and runtime safety that does not fight your production stack.
Agent-ready artifacts
JSON bundles, schemas, and examples that agents can inspect reliably.
Same workflow everywhere
API, CLI, and MCP expose the same capture, inspect, and resolve flow.
Deterministic by design
The same incident produces stable, repeatable output.
Safe in production
SDKs avoid blocking requests, crashing hosts, or throwing uncaught exceptions.
Every interface, same capabilities
DebugBundle keeps the API, CLI, and MCP in sync, so every automation-critical capability is available wherever teams work, with the dashboard available for visual triage.
Ready to debug smarter?
Start locally, or use the hosted free tier when you want cloud ingestion. Upgrade when you need team collaboration, longer retention, and advanced features.