Debug production errors with Gemini CLI and MCP
Connect Gemini CLI to DebugBundle's MCP server and Agent Skill to investigate incidents, inspect debug bundles, and turn production errors into tested fixes.

By Owen Far
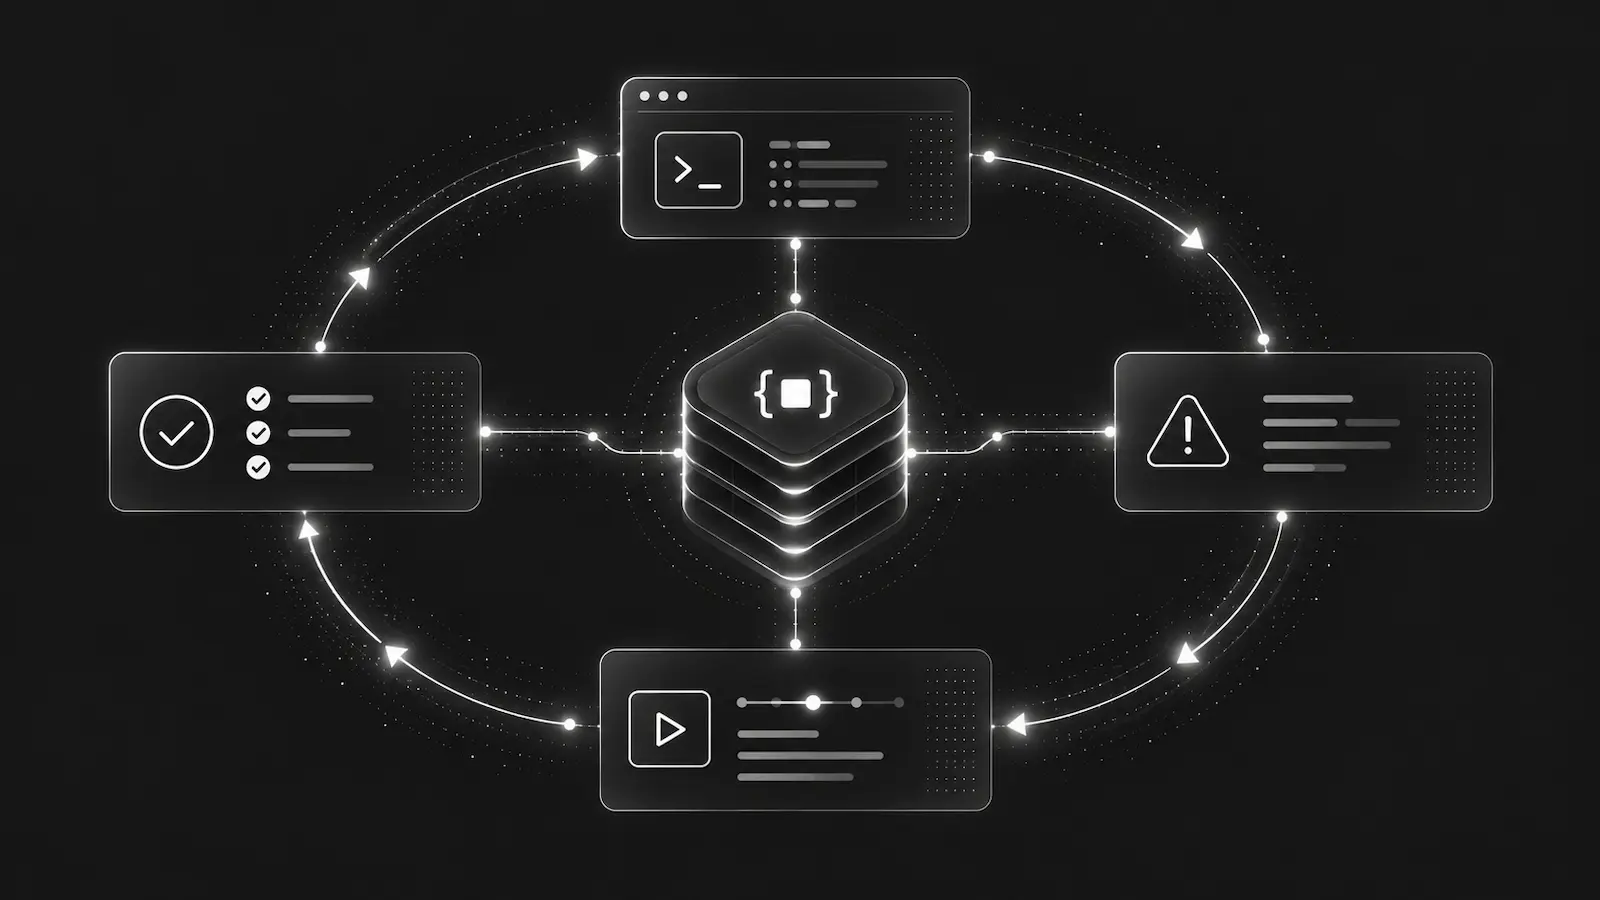
When you run Gemini CLI from your application's repository, it can inspect the code. Investigating a production error also calls for evidence from the running service: the failed request, earlier warnings, and the deployed release.
DebugBundle brings captured evidence into Gemini CLI through MCP. Our native extension pairs the connection with a debugging Agent Skill.
Start with the incident, then inspect the code
Our synthetic checkout bundle records a 500 response from a checkout request. The exception says code tried to read currency from null. An earlier warning says no pricing configuration was found for the shipping country.
That warning changes the task. A null guard may stop the crash, but checkout still needs a defined response when pricing is unavailable. With the request, logs, and release context in one bundle, Gemini CLI can trace the code path and propose a regression for the intended behavior. Missing evidence stays visible.
Connect Gemini CLI to DebugBundle MCP
Gemini CLI supports extensions that bundle MCP servers and Agent Skills. Install our first-party extension from GitHub:
gemini extensions install https://github.com/debugbundle/debugbundle-geminiIt includes the published DebugBundle MCP server and workflow skill. Check gemini extensions list, gemini skills list, and gemini mcp list after installation. The Gemini extension gallery is a separate discovery channel and may take time to index a new release.
You can also connect the published MCP server directly. From your application repository:
gemini mcp add --scope user debugbundle npx -y @debugbundle/mcp@1.12.1 --local-auth
gemini mcp list
If the application is new to DebugBundle, set up capture first. debugbundle setup --agent gemini-cli --non-interactive prepares its profile, project skill, and GEMINI.md guidance. Gemini CLI gives the project skill priority over the extension skill, so it can follow your actual services and tests.
Local captured incidents do not require a cloud account. For hosted incidents, run debugbundle login on the MCP host, then restart the connection. The --local-auth profile uses saved member authentication without putting a token in a tool call. SDK project tokens are for ingestion, not incident retrieval. The Gemini CLI setup guide covers both connection paths and the extension's current status.
Give Gemini CLI one bounded investigation
Start Gemini CLI in the application repository. Confirm the connection, choose local evidence or the exact hosted project, and read one incident's bundle and reproduction details. For example:
Read this repository's DebugBundle skill and profile. Investigate one active checkout incident in production. Use the incident and bundle to explain the likely cause and missing evidence. Add a regression for the intended behavior, make a focused fix, and run the relevant tests. Leave deployment and incident resolution for review.
Review captured requests and reproduction commands before execution; a replay can have real effects. A passing local test and a stopped production error are separate checks.
If you already use Gemini CLI for code changes, try the example bundle to see the evidence it can work from. Then follow the Gemini CLI guide to connect one instrumented application.